Introduction to ThreatGet
Creating a diagram
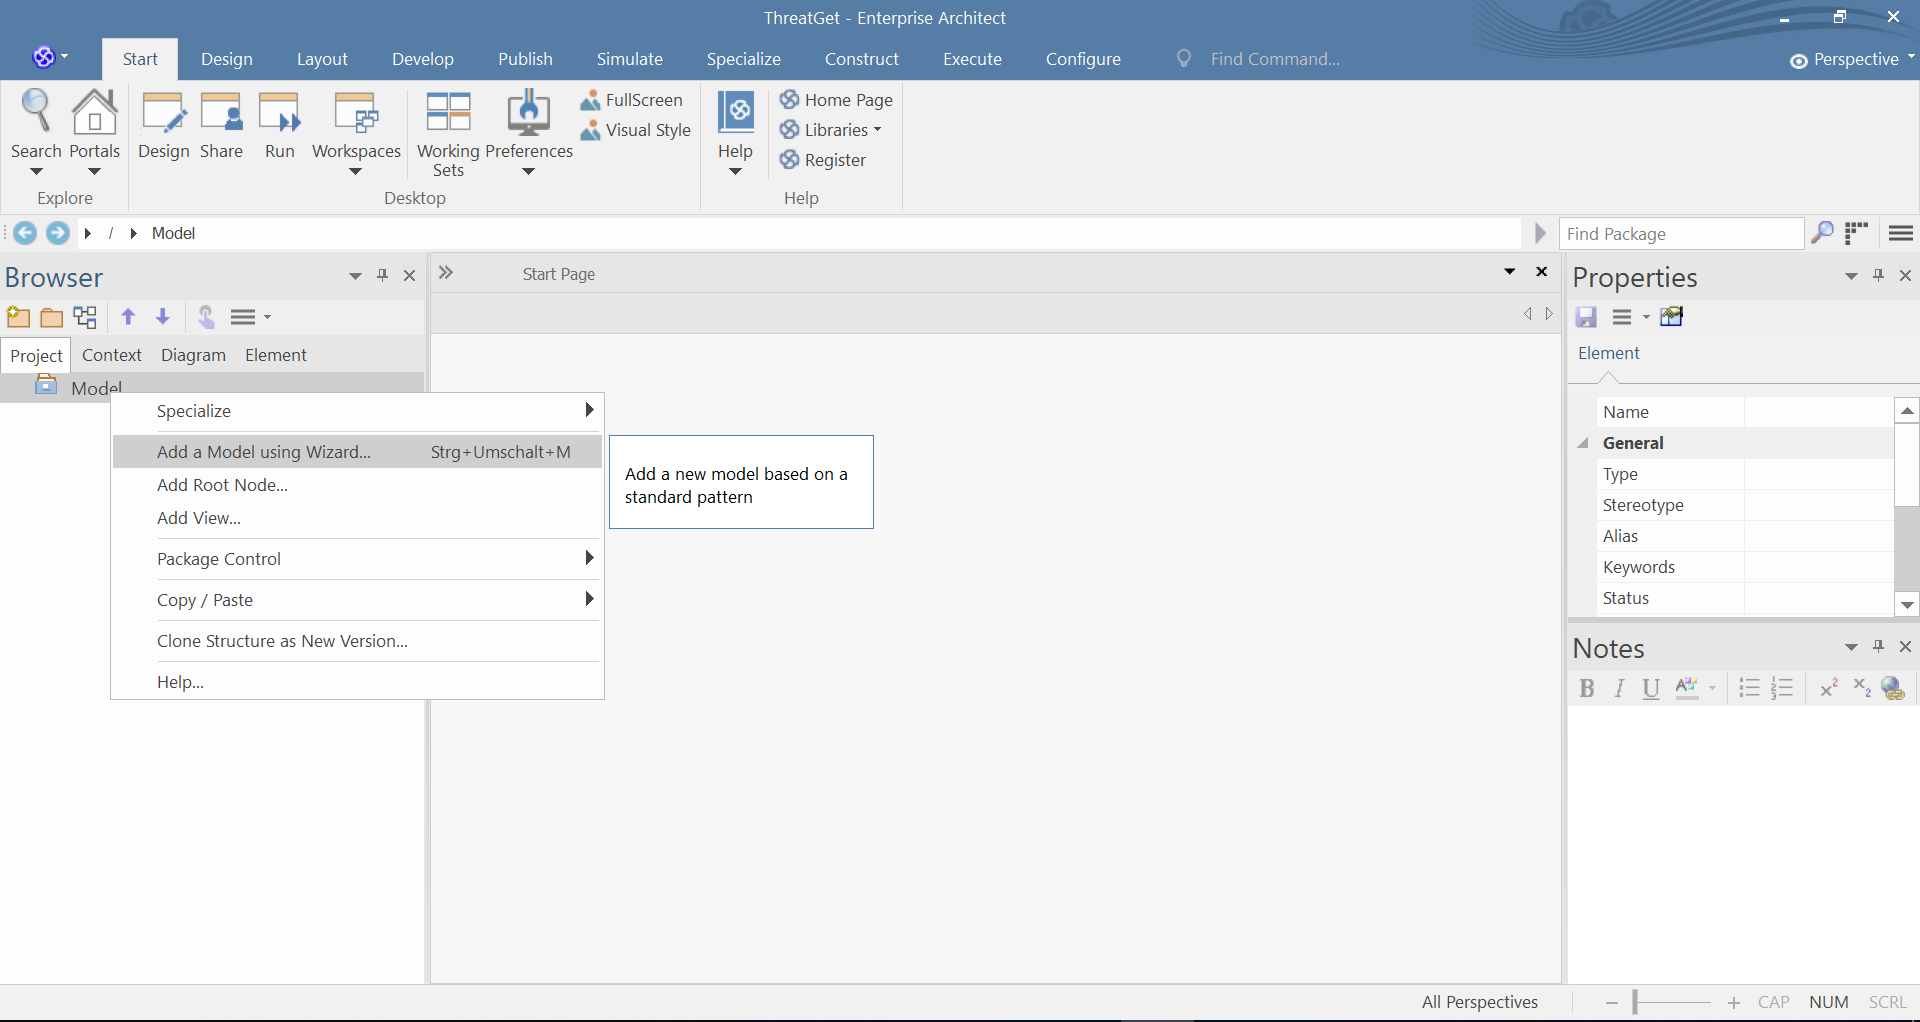
The First step is to add a model, this can be done by right clicking the Model from the Project Browser, and then clicking on Add a Model using Wizard, as shown below.
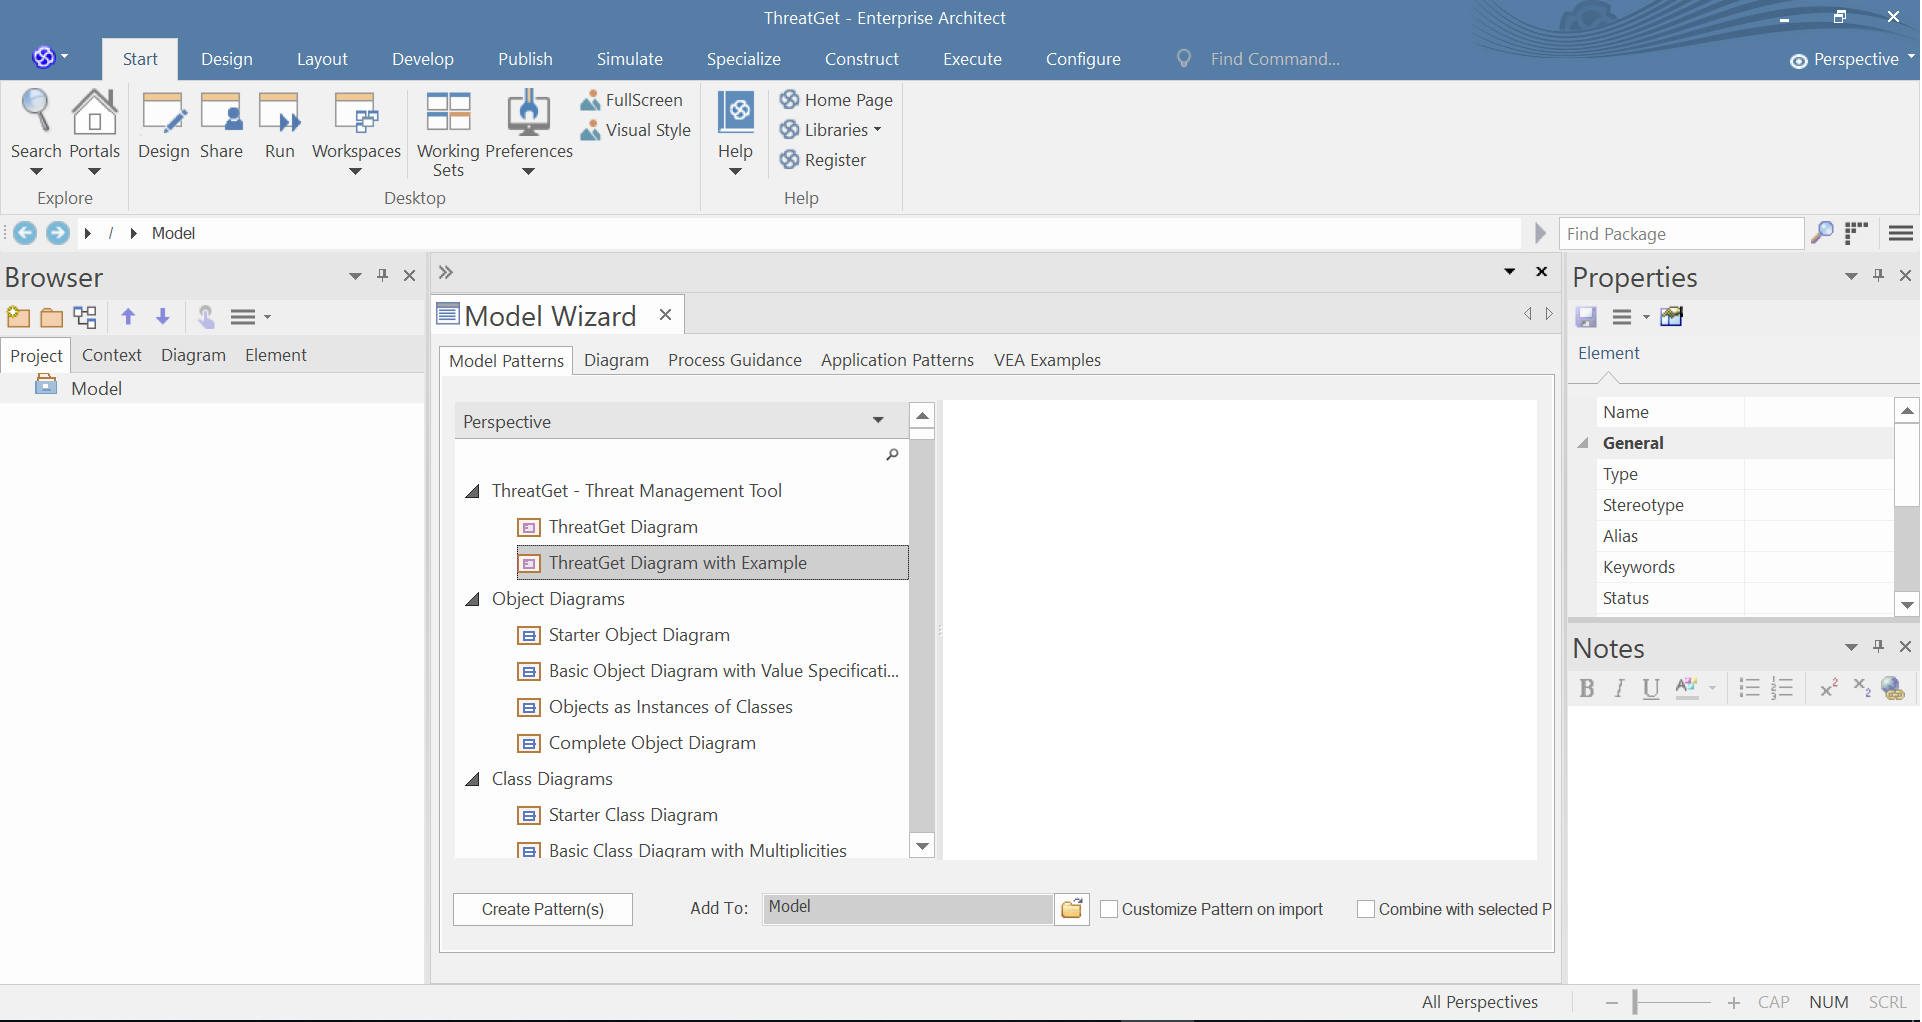
You can choose between two ThreatGet diagrams. To create an empty diagram, please select ThreatGet Diagram and then click on Create Pattern. You can model in the ThreatGet empty diagram a simple example with elements, connections, boundaries, and tagged values.
The ThreatGet Diagram with Example is a pre defined ThreatGet AIT-model that contains elements, connections, and tagged values from the ThreatGet Toolbox. It also includes a model description. This diagram is a reasonable basis for the first execution of ThreatGet.
You can now open the default example by expanding Model and then ThreatGet Example and double-clicking on Threat Model.
Note: If you can not see the ThreatGet model variations in "Add Model Using wizard ...", then check your ThretGet installation & server configuration
Running the Analysis
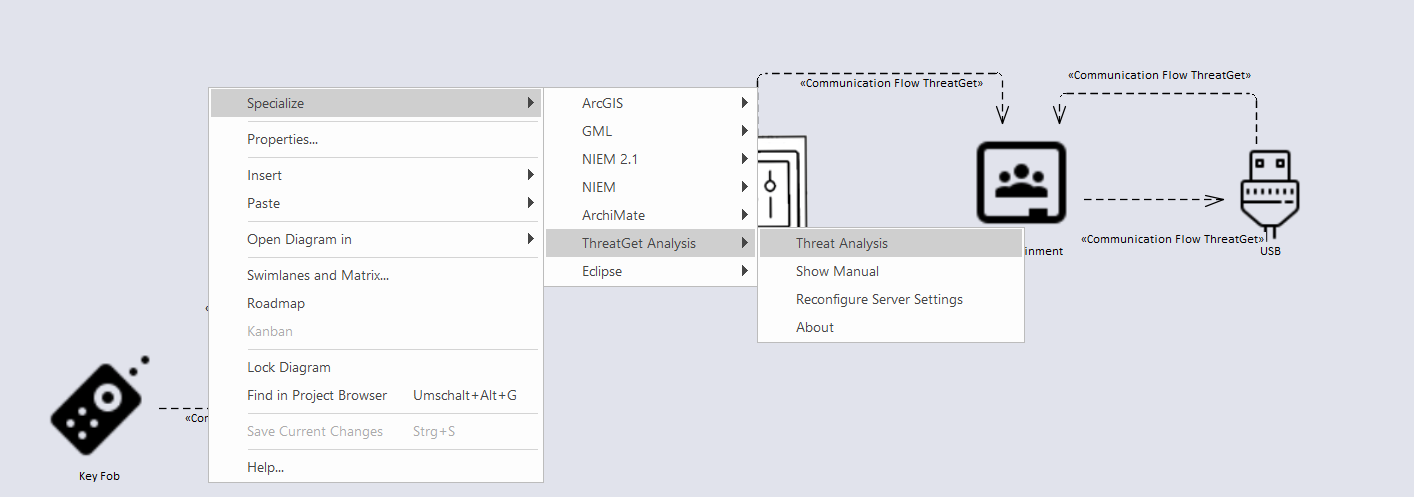
In the Project Browser, right-click either on the package or the diagram itself and then select Specialize ➺ ThreatGet Analysis ➺ Threat Analysis. In our case, the package is called ThreatGet Example.
The Threat Analysis creates a new package where analysis details are stored. It is visible in the Project Browser and can be deleted when it is no longer needed. Further, a new tab titled Threat Analysis is opened.
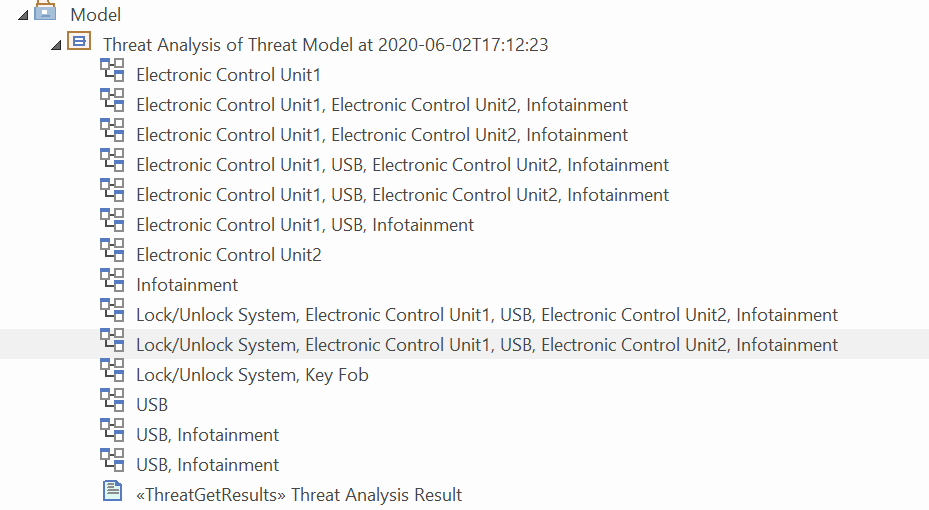
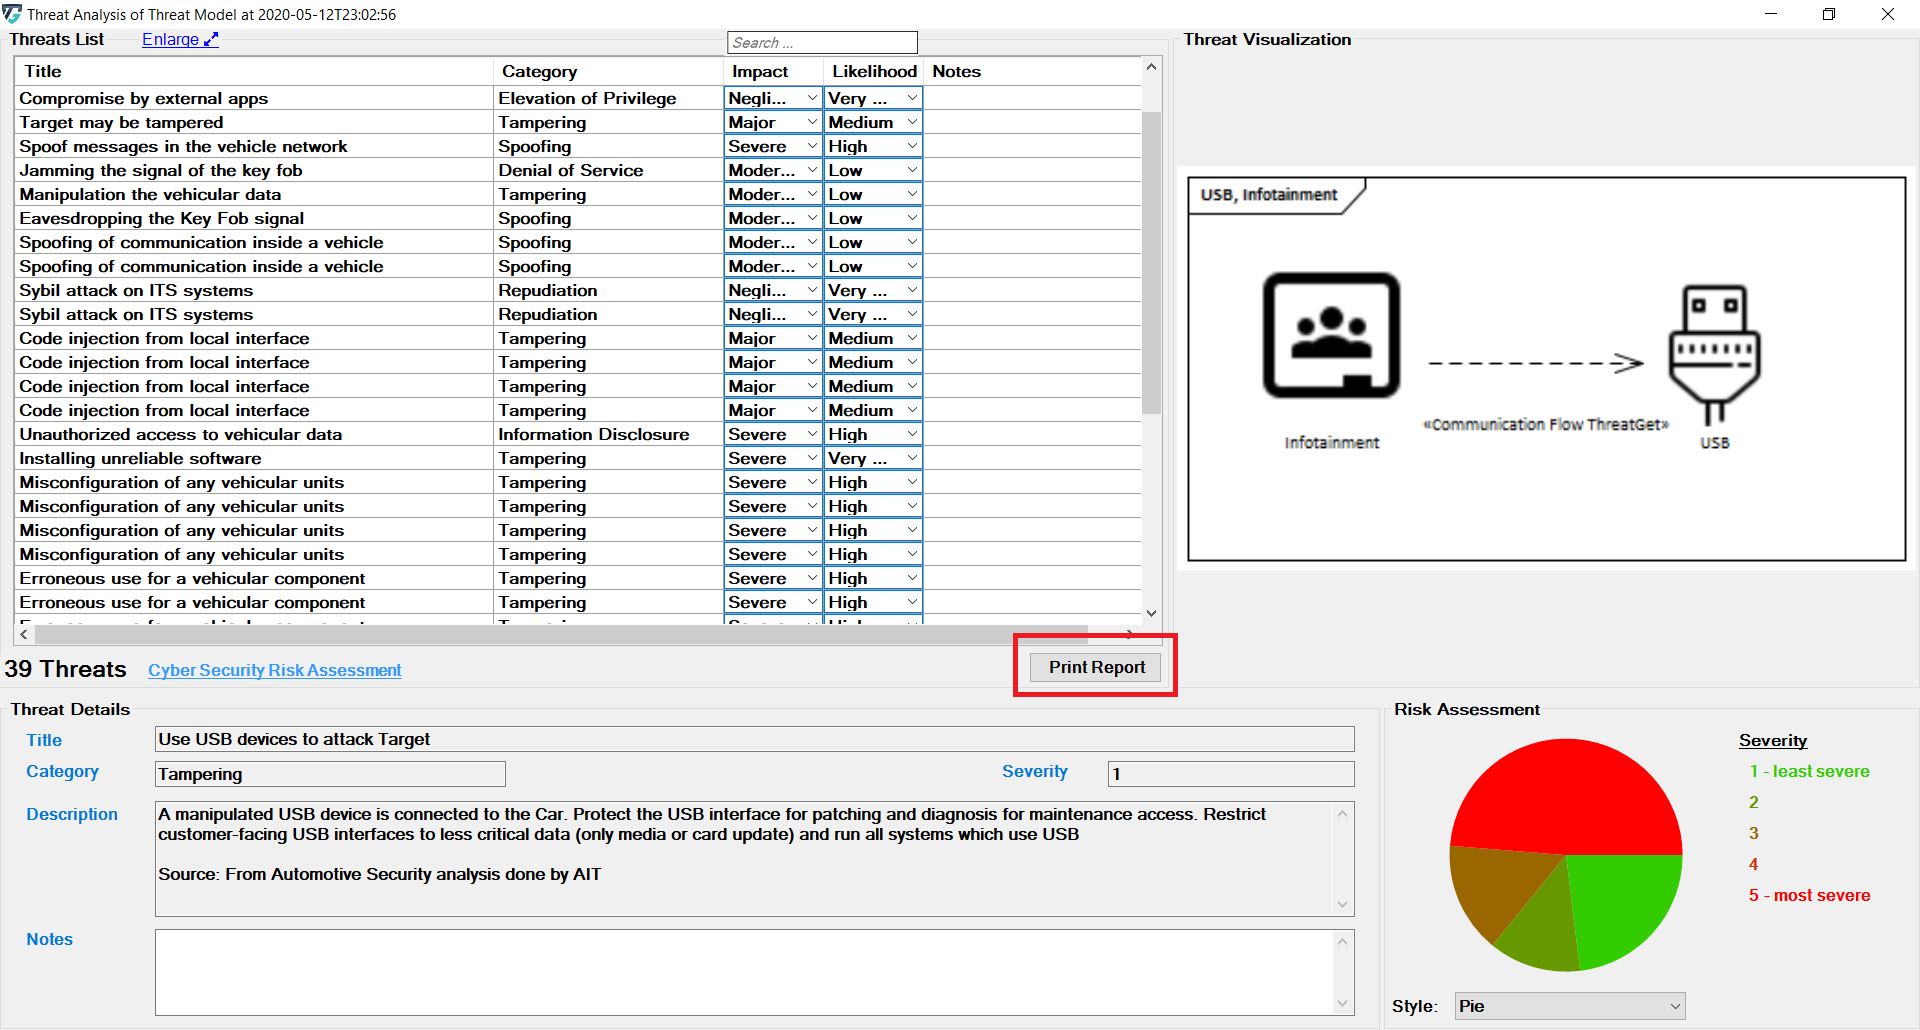
Threat Analysis generates a list of all the potential threats of overall affected elements in the given example model, as shown below.
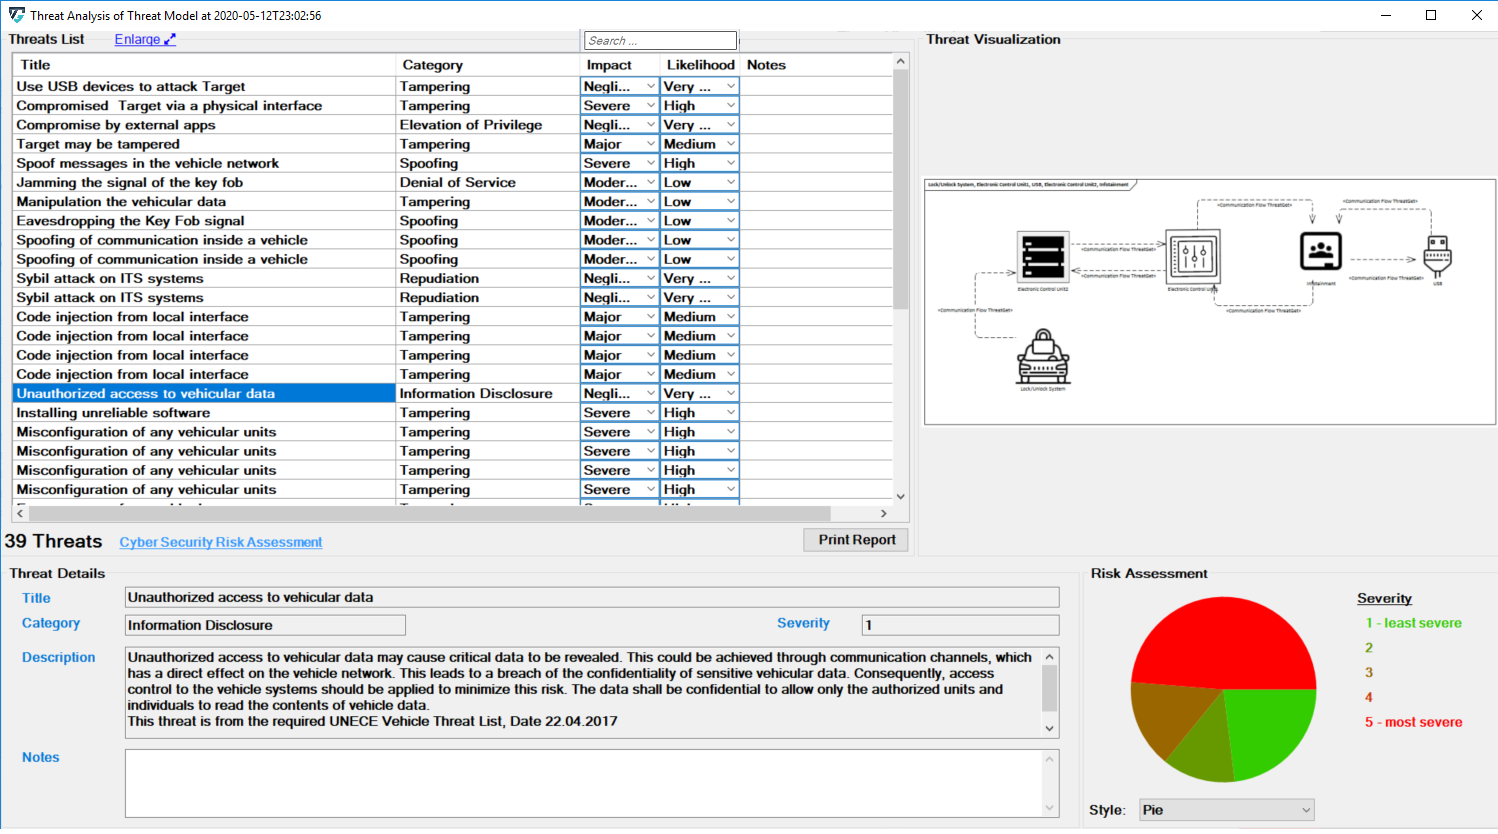
Scroll in the Threat List table to reveal Impact and Likelihood values. On the right side, there is a diagram that depicting the selected threat. If several elements are involved in a threat, they are all in the diagram. All related details for each identified threat can be viewed at the bottom section represented as Threat Details.
Each Threat is categorized based on the STRIDE model and is further annotated with two additional parameters, Impact and Likelihood.
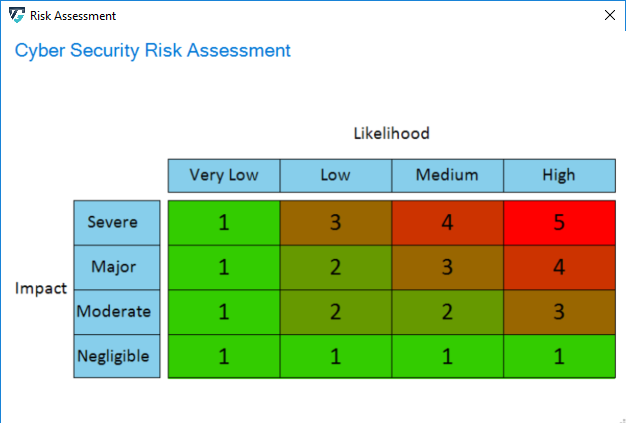
The risk severity is calculated as Impact x Likelihood. An explanation can be accessed by clicking on the Cyber Security Risk Assessment link. The dialog is show below.
Five chart styles are available for representing the distribution of threats based on the Severity of the Risk, as shown below.
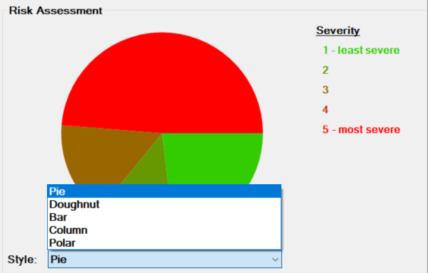
The diagrams on the right are also available in the analysis package.
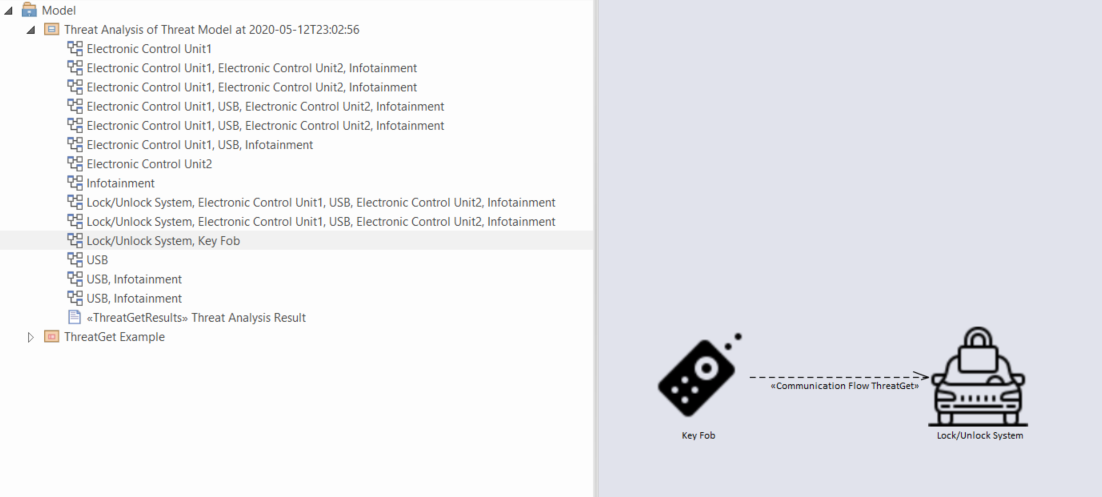
Threats corresponding to each communication flow can be viewed by expanding the subpackage in the Threat Analysis package in the Project Browser. The diagram below represents the threats corresponding to communication flow Key Fob to Lock/Unlock antenna. Similarly, threats corresponding to any communication flow in the project browser can be viewed.
Printing a Report
To generate a threat analysis report click on Print Report button as shown below.
Click on the symbol ... adjacent to Save Output to, select the destination file path to save the report as shown below.
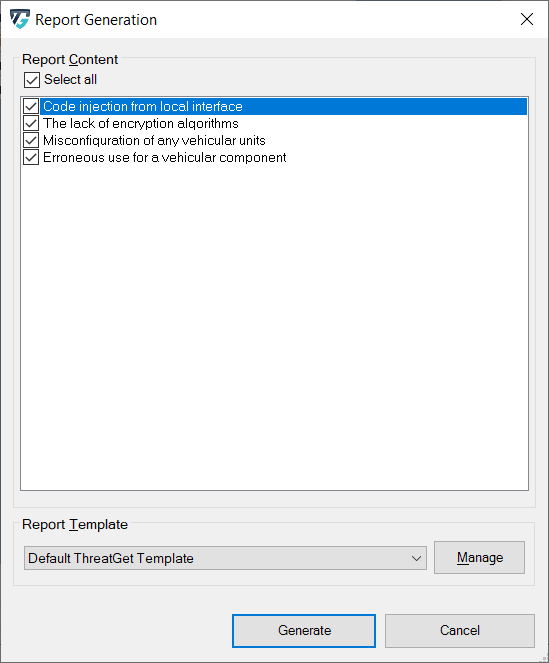
After you have selected the desired path, you can now specify whether you want to have all or part of the analysis in the report. By default, all threats found are selected. You can deselect individual threats by clicking the box. You can also use Select/deselect all to select or deselect all elements at once.
Now you can open the ThreatGet Report and explore the details of the analysis.